Wednesday, 8 May 2013

WEIRD GEOLOGICAL FEATURES SPIED ON MARS (http://ow.ly/kP3cm):
We may be routinely orbiting, roving, drilling and lasing Mars, searching for elusive traces of life and reconnoitering sites for future human missions, but that doesn't mean studies of the red planet don't throw up surprises.

On the contrary!
 
Observation of the strange features discovered by the HiRISE camera on NASA's Mars Reconaissance Orbiter (MRO) at the southern edge of Acidalia Planitia on Mars. The main cluster of pits on the left side of the photo are approximately 500 meters long and 100 meters wide.
NASA/JPL/University of Arizona
Gallery
WeirdestMarsCratersSpottedbyHiRISE:Photos
View Caption + 
View Caption + 
View Caption + 
View Caption + 
View Caption + 
View Caption + 
View Caption + 
View Caption + 
View Caption + 
View Caption + 
View Caption + 
View Caption + 
View Caption + 
View Caption + 
View Caption + 
We may be routinely orbiting, roving, drilling and lasing Mars, searching for elusive traces of life and reconnoitering sites for future human missions, but that doesn't mean studies of the red planet don't throw up surprises. On the contrary.
Take this March 21, 2013 observation by the High-Resolution Imaging Science Experiment (HiRISE) camera on board NASA's Mars Reconnaissance Orbiter (MRO) of the southern edge of Acidalia Planitia, a plain located in the planet's northern hemisphere.
PHOTOS: Weirdest Mars Craters
These irregular depressions with weird raised rims aren't impact craters and they can't be wind-blown features as the pits contain boulders that could not have been moved by the Martian winds. HiRISE mission scientists don't believe they could be caused by volcanism either.
Scientists believe the Acidalia Planitia region of Mars was once the location of a huge ocean, so it seems plausible that it may have been caused by some fluvial process. They may also have been caused by shallow lenses of water ice that have since sublimated into the atmosphere, leaving these small basins. But that doesn't obviously explain why the depressions have raised rims.
PHOTOS: Mars Through Curiosity's Powerful MAHLI Camera
"Ancient glaciation is another possibility, perhaps depositing ice-rich debris next to topographic obstacles," said HiRISE principal investigator Alfred McEwen, planetary geologist at the University of Arizona. "Future images of this region may provide clues, but for now this is a mystery."
A wider-angle view of the mystery pits show them hugging a long, raised ridge:
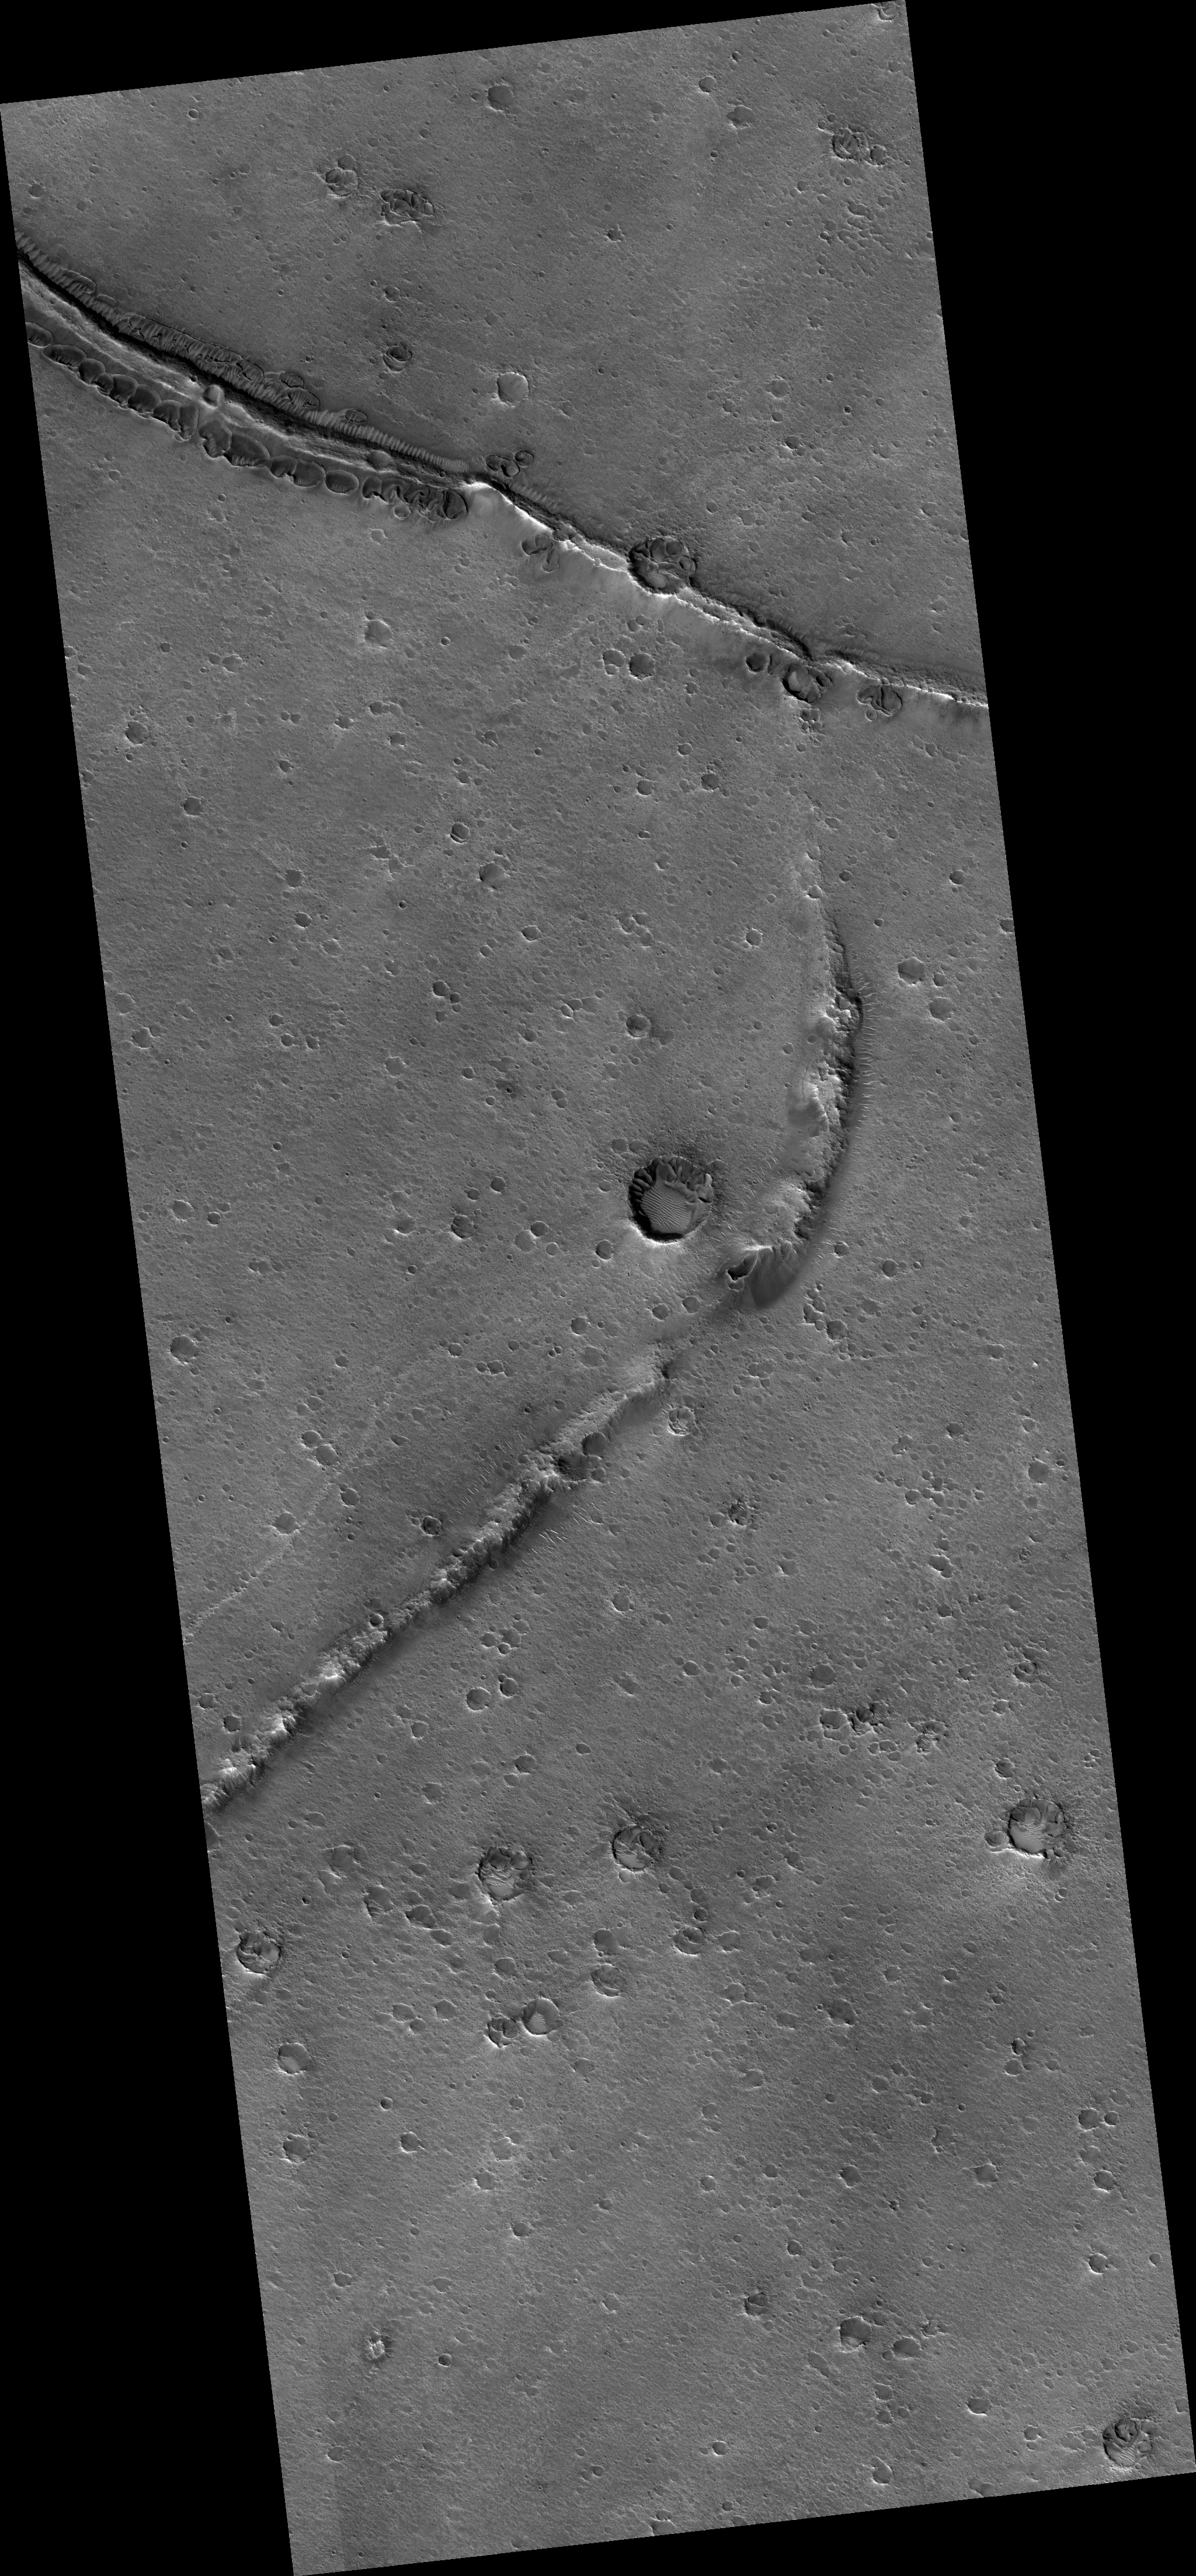
Wide context view of the strange geological features discovered by the HiRISE camera on NASA's Mars Reconaissance Orbiter (MRO) at the southern edge of Acidalia Planitia on Mars. Click image to see the whole region.
NASA/JPL/University of Arizona
If I had to place a bet, I'd put my money on some kind of ancient permafrost process -- perhaps the water ice sublimation idea or some more complex subsurface process that caused the slumping of material. The long ridge that the pits seem to be formed along is interesting too, so some kind of tectonic process shouldn't be ruled out.
Acidalia Planitia is a fascinating region. It is, after all, home to the famous "Face on Mars" mystery that captivated the world for years until advanced orbital missions proved that the "head" was actually a mesa (a Mars hill) and the "face" was just a trick of the light.
This little mystery of odd depressions, however, probably won't be solved until we can get a robotic or human mission to view the pits up-close. Until then, we can only speculate.
http://ow.ly/kP3cm

Tuesday, 7 May 2013


The Earth’s Centre is 1000 Degrees Hotter than Previously Though

cientists have determined the temperature near the Earth’s centre to be 6000 degrees Celsius, 1000 degrees hotter than in a previous experiment run 20 years ago. These measurements confirm geophysical models that the temperature difference between the solid core and the mantle above, must be at least 1500 degrees to explain why the Earth has a magnetic field. The scientists were even able to establish why the earlier experiment had produced a lower temperature figure. The results are published on 26 April 2013 in Science.

The Earth’s core consists mainly of a sphere of liquid iron at temperatures above 4000 degrees and pressures of more than 1.3 million atmospheres. Under these conditions, iron is as liquid as the water in the oceans. It is only at the very centre of the Earth, where pressure and temperature rise even higher, that the liquid iron solidifies. Analysis of earthquake-triggered seismic waves passing through the Earth, tells us the thickness of the solid and liquid cores, and even how the pressure in the Earth increases with depth. However these waves do not provide information on temperature, which has an important influence on the movement of material within the liquid core and the solid mantle above. Indeed the temperature difference between the mantle and the core is the main driver of large-scale thermal movements, which together with the Earth’s rotation, act like a dynamo generating the Earth’s magnetic field. The temperature profile through the Earth’s interior also underpins geophysical models that explain the creation and intense activity of hot-spot volcanoes like the Hawaiian Islands or La Réunion.
To generate an accurate picture of the temperature profile within the Earth’s centre, scientists can look at the melting point of iron at different pressures in the laboratory, using a diamond anvil cell to compress speck-sized samples to pressures of several million atmospheres, and powerful laser beams to heat them to 4000 or even 5000 degrees Celsius.”In practice, many experimental challenges have to be met”, explains Agnès Dewaele from CEA, “as the iron sample has to be insulated thermally and also must not be allowed to chemically react with its environment. Even if a sample reaches the extreme temperatures and pressures at the centre of the Earth, it will only do so for a matter of seconds. In this short timeframe it is extremely difficult to determine whether it has started to melt or is still solid”.
This is where X-rays come into play. “We have developed a new technique where an intense beam of X-rays from the synchrotron can probe a sample and deduce whether it is solid, liquid or partially molten within as little as a second, using a process known diffraction”, says Mohamed Mezouar from the ESRF, “and this is short enough to keep temperature and pressure constant, and at the same time avoid any chemical reactions”.
The scientists determined experimentally the melting point of iron up to 4800 degrees Celsius and 2.2 million atmospheres pressure, and then used an extrapolation method to determine that at 3.3 million atmospheres, the pressure at the border between liquid and solid core, the temperature would be 6000 +/- 500 degrees. This extrapolated value could slightly change if iron undergoes an unknown phase transition between the measured and the extrapolated values.
When the scientists scanned across the area of pressures and temperatures, they observed why Reinhard Boehler, then at the MPI for Chemistry in Mainz (Germany), had in 1993 published values about 1000 degrees lower. Starting at 2400 degrees, recrystallization effects appear on the surface of the iron samples, leading to dynamic changes of the solid iron’s crystalline structure. The experiment twenty years ago used an optical technique to determine whether the samples were solid or molten, and it is highly probable that the observation of recrystallization at the surface was interpreted as melting.
“We are of course very satisfied that our experiment validated today’s best theories on heat transfer from the Earth’s core and the generation of the Earth’s magnetic field. I am hopeful that in the not-so-distant future, we can reproduce in our laboratories, and investigate with synchrotron X-rays, every state of matter inside the Earth,” concludes Agnès Dewaele.
The research team was led by Agnès Dewaele from the French national technological research organization CEA, alongside members of the French National Center for Scientific Research CNRS and the European Synchrotron Radiation Facility ESRF in Grenoble (France).


Analysing ash flows from volcanic explosions

Researchers in the US have analysed ash interactions from volcano plumes in a variety of conditions and identified two aggregation regimes – dry and wet – in which particle adhesion is controlled by electrostatic and hydrodynamic forces, respectively. This research – part of a larger investigation into the prediction of eruptive ash dispersal – may act to refine current models of volcanic-plume behaviour. The ability to model the behaviour of the eruptive columns created by explosive volcanoes is much sought after to better understand and predict ash-based hazards.
Volcanic plumes – the kilometres-high columns of hot, upthrust ash created in volcanic eruptions – are among the most dangerous by-products of volcanism, and can have wide-reaching hazardous effects. Columns can collapse under their own weight, forming pyroclastic flows – devastating surges of gas and rock that can reach speeds in excess of 700 km per hour – which can burn and flatten objects in their path. In addition, the ash clouds themselves can pose a serious threat to aircraft, even at hundreds of kilometres away from the eruption site – with ash able to clog up engines and scratch cockpit windows until they become opaque.

Obscure models

Despite being well documented in present day events and past volcanic deposits, the processes of ash aggregation are a major source of uncertainty in current models of eruptive-column behaviour. To model ash behaviour in conditions similar to those found in volcanic plumes, the researchers, based at Georgia Institute of Technology, assembled a controlled atmospheric chamber with dimensions of 15 × 18 × 15 cm. Ash particles were released at the top of the chamber and allowed to collide with a fixed sample – a single layer of ash glued to a glass slide – beneath. These collisions were then observed by means of a high-speed camera.
Collision velocities and kinetic energies of the falling particles before and after impact were estimated, along with the ratio of collisions that resulted in the ash particles adhering to each other. Using two samples of real volcanic ash with different compositions – and one silica-based ash proxy – researchers tested the effect that atmospheric pressures, residence times (how long the ash particles remain in the atmosphere) and humidity had on the ash aggregation.
"This study examines the aggregation potential of volcanic ash, or how likely it is for two colliding ash particles to stick together," explains paper author Jennifer Telling, a geophysicist at Georgia Institute of Technology. "Using the data collected in laboratory experiments, we derive a series of equations to describe the aggregation potential of wet and dry ash particles," she says. The team observed that while the kinetic energy of the colliding ash particles was the major factor in determining whether or not the particles remained stuck together on impact, humidity also played a significant role. Higher relative humidity (greater than 71%) and long residence times allow the target ash particles to adsorb a larger surrounding film of water from the atmosphere, which acts to hydrodynamically slow down the particles as they impact, thus increasing the likelihood that they stick together. In drier atmospheric regimes, electrostatic forces were seen to be the main force acting to retard the colliding ash particles.
"[This research] is an important contribution to our knowledge of the process of ash aggregation," says Michael Sheridan, a volcanologist at the University at Buffalo, who was not involved in the study. He comments that total grain-size distribution is a vital parameter in estimating the dispersal of volcanic ash, but that many previous models assume particle sizes remain fixed during transport and deposition. "It is well known that many processes can affect the surface properties of particles between the time of eruption and their arrival at the Earth's surface," he adds. "The aggradation model presented here must be seriously considered in future models of dispersion of volcanic ash in an eruptive plume."

Real-life events

To test the robustness of their modelling, the researchers plan to run a large-scale volcanic simulation. By emulating a specific, real-life eruption event, the output of their numerical models can be compared with the corresponding volcanic deposits in the field to see whether incorporating these new aggregation relationships can improve our predictions.
Explaining that this study represents an important step in the development of plume-dispersal models, Mark Woodhouse of the University of Bristol, who was not involved in this research, told physicsworld.com that "a comparison of predictions of ash-transport models utilizing the products of this research with observations of deposits and ash clouds from volcanic eruptions will be a stringent test of the work".
Given the dangers and large-scale impacts of eruption columns, the ability to accurately predict the movement and duration of such volcanic-ash plumes could be of great benefit for both hazard mitigation and also to the airline industry. "The models used to predict ash-dispersal patterns are extremely complex," explains Telling. "We hope that by examining the conditions under which ash can aggregate and its actual potential to stick together, our research can improve the predictive capability of large-scale volcanic simulations," she says.
The research is to be published in Geophysical Research Letters.

About the author

Ian Randall is a science writer based in New Zealand


Dark lightning sheds light on gamma-ray mystery

Scientists in the US say they have found a dramatic new electrical-discharge mechanism that could explain how thunderstorms can produce flashes of gamma radiation. Called "dark lightning", the effect is silent, invisible to the eye and a potential threat to aeroplane passengers – at least according to the researchers' models. This is because such lightning has the potential to produce intense terrestrial gamma-ray flashes (TGFs) and could deliver a radiation dose equal to a full-body X-ray-tomography (CT) scan to nearby air travellers.
TGFs are extremely bright pulses of gamma rays emanating from the Earth's atmosphere. They last just a few tenths of a millisecond but are capable of temporarily blinding satellite-based instruments located hundreds of kilometres away. Scientists have known about TGFs since the early 1990s, when they were discovered by accident by instruments designed to measure gamma rays from distant astrophysical sources such as supernovae and black holes.

'Garden-variety thunderstorms'

For a long time, no one could work out where TGFs were coming from. "It was logical to think that if we can see them from space, they must come from the top of the atmosphere," explains physicist and lightning expert Joseph Dwyer of the Florida Institute of Technology, who led this latest work. It turns out that was wrong: "We now know that they come from deep within the atmosphere, from garden-variety thunderstorms," he explains.
All types of thunderstorm, large or small, appear to produce TGFs, with an approximate frequency of one for every thousand bolts of conventional lightning. But until very recently, it was not at all clear how they were doing it. Now Dwyer and colleagues have come up with a physics-based model that offers an explanation and quantifies the potential threat that TGFs pose to aircraft, which routinely fly at similar altitudes.

Floating-particle accelerator

In a storm cloud, rapidly rising swells of hot air force ice and water particles to rub against one another, producing swathes of ions and establishing a huge potential difference between the top (positively charged) and middle of the cloud (negatively charged). Lightning is thought to occur when the insulating layer of air between the two charge centres suddenly breaks down. But as the storm charges up, the strong electric field also transforms the cloud into a giant floating-particle accelerator. Electrons accelerated to almost the speed of light crash into air molecules, producing yet more fast-moving electrons in an avalanche effect.
At relativistic speeds, the electrons emit Bremsstrahlung gamma rays, some of which disintegrate into an electron and a positron. The newly created electrons join the rest in surging upwards and producing gamma rays, while the positrons plunge downwards towards the negative centre of the storm cloud, glancing off air molecules as they go and initiating countless more cascades of electrons. "You create this feedback loop: the positrons make the electrons, the electrons make the positrons," explains Dwyer. "So you get sort of an avalanche of avalanches."

Explosive yet invisible

The explosive cascade produces around 1017 electrons in just a few tenths of a millisecond – spewing out gamma rays all the while – at which point the number of charged particles is so great that the thunderstorm's electrical field collapses and it discharges rapidly and invisibly. The electrical currents produced by these beams of high-energy electrons are comparable to those produced by conventional lightning – tens of thousands of amps in magnitude.
The Florida Tech model shows promise because not only does it predict TGFs with the same frequency and pulse structure as those observed by satellites, it also predicts that TGFs should have large radio bursts associated with them – a phenomenon routinely measured by terrestrial lightning-measurement networks.
The team used its model to calculate the radiation dose to a person aboard a plane in a storm. It found that near the top of a storm, the dose is equal to about 10 chest X-rays – the dose we receive from natural background sources over the course of a year. But nearer the centre of the storm, the dose could be "about 10 times larger, comparable to some of the largest doses received during medical procedures and roughly equal to a full-body CT scan," according to Dwyer.

Sizable dose of radiation

"On rare occasions...it may be possible that hundreds of people, without knowing it, may be simultaneously receiving a sizable dose of radiation from dark lightning," says Dwyer, but stresses that the risk is not one to be overly concerned about – pilots already do their utmost to avoid and circumnavigate thunderstorms. "You'd have to be inside the thunderstorm [to be at risk], and not only inside but in the worst part of the storm at precisely the wrong time."
"This sort of research is obviously relevant, as these are phenomena occurring just above us," says Nikolai Østgaard, a physicist from the University of Bergen, Norway, who was not involved in the research. "But we need more observations...All measurements from space of these TGFs have been made by instruments designed for other purposes, but now there are several planned missions especially designed to detect TGFs and optical lighting."
David Smith, of the University of California, Santa Cruz, finds the theoretical work "compelling and beautiful". But, he cautions, "There are competing ideas for how TGFs are produced, that haven't been ruled out, and in these models the TGF is never 'dark' – it requires an ordinary lighting flash to take place, and follows it closely." Smith is soon set to team up with Dwyer and colleagues to fly the ADELE gamma-ray detector around hurricanes on the unmanned Global Hawk aircraft.
The research was described on 10 April at a meeting of the European Geosciences Union in Vienna, Austria.

About the author

Ceri Perkins is a science writer based in New York City


Earth is closer to the edge of Sun's habitable zone

The Earth could be closer than previously thought to the inner edge of the Sun's habitable zone, according to a new study by planetary scientists in the US and France. The research also suggests that if our planet moved out of the habitable zone, it could lead to a "moist greenhouse" climate that could kick-start further drastic changes to the atmosphere.
A star's habitable zone is the set of orbits within which a planet could have liquid water on its surface – and being within this zone is considered to be an important prerequisite for the development of life.
The current consensus is that the Sun's habitable zone begins at about 0.95 astronomical units (AU), a comfortable distance from the Earth's orbit at 1 AU. However, this latest work by James Kasting and colleagues at Penn State University, NASA and the University of Bordeaux suggests that that inner edge of the zone is much further out at 0.99 AU.

Lost oceans

"Our new climate model predicts that we are closer to the moist-greenhouse scenario than we had thought," says Kasting. In this scenario, the stratosphere becomes wet and fully saturated as the Earth's surface warms. This results in the dissociation of water molecules and the release of hydrogen into space. Depending on the levels of atmospheric saturation, the oceans would be completely lost over timescales as long as several billion years. This, say the scientists, would result in our climate changing to resemble a Venus-styled runaway greenhouse.
Penn State's Ramses Ramirez points out that the atmosphere currently has an average surface relative humidity of 77%, which gradually decreases to 10% or less above an altitude of 10 km – so the atmosphere is far from fully saturated. However, there are two ways that the Earth's atmosphere could move in that direction.

Slipping over the edge

One is that the Earth's orbit changes and it slips across the 0.99 AU inner edge. The second is that the Earth remains at 1 AU but rising temperatures caused by greenhouse gases such as water vapour and carbon dioxide lead to a moist greenhouse. Indeed, the researchers are now calculating how much carbon dioxide would be needed for the second scenario to occur.
Scientists believe that a moist greenhouse would begin when the global average temperature reaches 340 K – whereas the current average is 288 K. Kasting says that under really pessimistic assumptions – a 10-fold to 20-fold increase in atmospheric carbon dioxide – it could be possible for the average temperature to reach 340 K. However, he points out that even if humans continue to burn fossil fuels at a very high rate, a catastrophic moist greenhouse would not kick in until at least 2300.
Other researchers, however, point out that the Earth has been much hotter in the past and such a transition did not occur. Dorian Abbot, a climate scientist at the University of Chicago, points out that average temperatures were about 10–15 K warmer during the Cretaceous period. "As far as we know, Earth has never been in a moist-greenhouse state," says Abbot. "We certainly did not lose our entire oceans."

Signatures of moist greenhouse by 2100?

Ravi Kopparapu at Penn State says that if current IPCC temperature projections of a 4 K increase by the end of this century are correct – which assumes a rapidly growing and fossil-fuel intensive global economy – our descendants could start seeing the signatures of a moist greenhouse by 2100.
Kopparapu argues that once the atmosphere makes the transition to a moist greenhouse, the only option would be global geoengineering to reverse the process. In such a moist-greenhouse scenario, not only are the ozone layers and ice caps destroyed, but the oceans would begin evaporating into the atmosphere's upper stratosphere.
Ramirez admits that there are two major caveats associated with the work. The first is the assumption that the modelled atmospheres are already fully saturated. This means that the atmosphere holds as much water vapour as it possibly can at a given temperature. The second is that the models do not incorporate cloud feedback, which could be important.

"Sobering" results

Despite these caveats, Kasting still thinks that the results are sobering. "If you are this close to [the] inner edge of the habitable zone, it is not as difficult to push yourself over...[and] that is catastrophic," he says.
However, Colin Goldblatt, a planetary scientist at the University of Victoria in Canada, cautions against taking the concept of a habitable zone too literally. "I can put a planet at 0.9 AU and that planet will be perfectly habitable," says Goldblatt. "It might not be where Kasting would like to retire, but things will live there."
The research is described in The Astrophysical Journal.


Saturday, 23 February 2013

A new video by a NASA spacecraft orbiting Mercury is showing the closest planet to the sun like never before, revealing the rocky world as an oddly colorful planet.
Scientists created the new video of Mercury from space using images captured by NASA's Messenger spacecraft, which has been studying the small planet from orbit since 2011. The video shows a complete global map of Mercury as it spins on its axis and was assembled using thousands of photos into a single view.
"This view captures both compositional differences and differences in how long materials have been exposed at Mercury's surface," Messenger mission scientists at the Johns Hopkins University Applied Physics Laboratory in Laurel, Md., explained in an image description. The laboratory oversees the Messenger mission for NASA. "Young crater rays, arrayed radially around fresh impact craters, appear light blue or white."
The colors of Mercury in the new video are actually enhanced to better differentiate between the different kinds of terrain on the planet, the researchers said. Altogether, the video shows 99 percent of the surface of Mercury with a resolution of about 1 kilometer per pixel.
"Medium- and dark-blue areas are a geologic unit of Mercury's crust known as the 'low-reflectance material,' thought to be rich in a dark, opaque mineral," Messenger scientists wrote. "Tan areas are plains formed by eruption of highly fluid lavas."
NASA's Messenger spacecraft (the name is short for the MErcury Surface, Space ENvironment, GEochemistry and Ranging) launched in 2004 and became the first spacecraft ever to orbit Mercury when it arrived at the planet in March 2011. The spacecraft's $446 million primary mission ended in 2012, and it is nearing the end of its first one-year mission extension.
During its two years orbiting Mercury, the Messenger spacecraft is expected to snap more than 168,000 photos of the planet, mission managers said.